It’s the 21st century. We build and ship applications faster than the gravitational speed of earth. Software development has been experiencing disruptive innovation over the last few years, and with the rising expectations of customers looking to get a superior experience, they are always searching for ways to release their products with faster time to market. In this blog we will explore a amazing library called BenchmarkDotNet
I was shocked to hear this Amazon deploys every 11.6 seconds
If you want to know how, watch the full talk below.
Now let’s jump into Visual Studio and cook the code.
Getting Started with BenchmarkDotNet
Let’s come back to our application now and let us find out how can we find performance issues in our .NET Application. There’s this amazing library called BenchMarkDotNet which i recently came across. Even for a experienced developer, finding performance issues is really hard and time consuming.
Now let’s pick a small block of code from our application or write a small piece of code to proceed.
So the above method retrieves something from the sql database. Now a normal developer cannot see any issues in it. Do you think the logic can be simplified ? Don’t you think the hard-coded strings will be a nightmare to deal with in the future ?
Let’s now rewrite the above block in a more simplified manner and test the performance of both the methods using BenchmarkDotnet.
Now look at the above piece of code. This can be done using a library called Dapper
- Clean
- Readable
- No hard-coded strings
Now let’s benchmark both of the methods using BenchmarkDotNet. Let us create a New console app, and add the nuget.
dotnet add package BenchmarkDotNet –version 0.11.5
Create a class with both of the methods in it. Now we will create another BenchMark.cs class where the magic takes place.
Notice the [Benchmark] Attribute on top of the method, which lets the Library know that this method needs to be included for benchmarking.
Now just invoke the benchmark runner from your main method.
Once i saw the results it was mind blowing. It automatically runs multiple iterations including warm-up, so usually like the rest of libraries you dont have to feed the number of times it should run etc.
Note : The benchmark project should be run in RELEASE mode.
WOW Moment
You can also find complete information about each iteration. You can export the data in different formats like (CSV, XML, JSON, and so on) or even generate beautiful plots but to view the plots you need to have R language installed.
Apart from the charts, there are other ton of features, like you can also manually control the iterations,switch between cold start or warmed instance etc..
So here’s the metrics for the two blocks which we previously wrote.
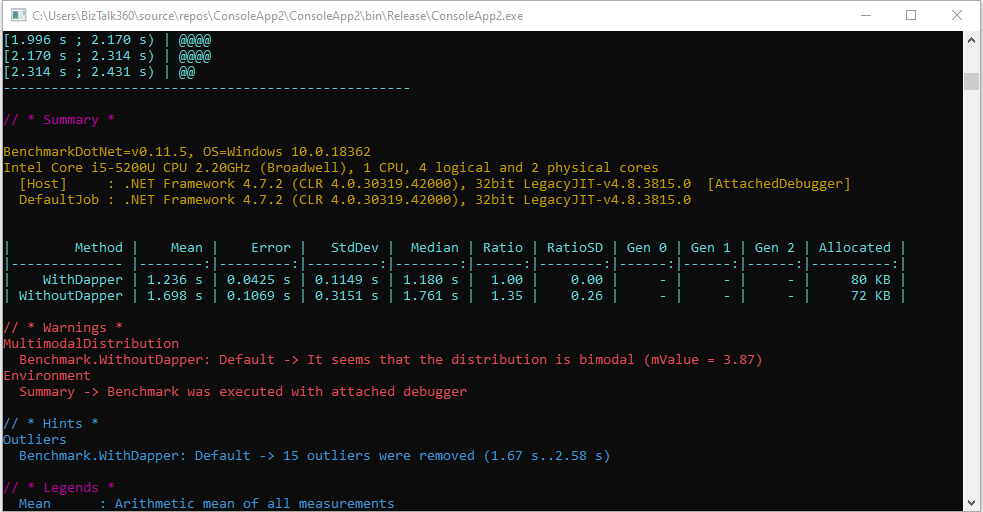
The WithDapper is the block of clean code that we wrote with the Dapper library for querying the database. The other one is the hard-coded way with complex logic. Even though there’s 8KB memory difference, notice the Mean time, for a small method which retrieves some data the difference is 1 second. How about inserting / updating the data ?
Conclusion
Using this library you can easily find issues in your code in no matter of time. Always try to write readable and maintainable code. Take some time to explore this library. Come up with your own examples. Instead of just guessing between two implementations measure it and let the numbers decide it.
For more blogs, follow TechMeet360.
If you’re using .NET, learn to use BenchmarkDotNet!